Ola Sanusi, PhD

Educator | Data Scientist | Researcher
View My LinkedIn Profile
| Analysis of Crime Types in Baltimore City, MD | Exploratory Data Analysis (EDA) Author: Ola Sanusi, PhD |
Introduction
This project involves using Exploratory Data Analysis (EDA) to draw inferences on crime types and crime rates in Baltimore City, MD. Historical crimes data of Baltimore City, MD was obtained from Baltimore Open Data Website to explore the different type of crimes occurring in the city at different times of the year. It is important that the Baltimore police department are able to forecast crime types so that they will be able to allocate appropriate resources to the right neighborhood and district. The project identify the most important crimes that need special attention.
The Dataset
The Baltimore City crime data consist of all crime types that occur between October 1963 and March 2021. Data preprocessing performed involves removing all columns that has over 70% missing values, dropping unneeded columns, filling remaining missing values with the mode of each categorical variables.
| CrimeDateTime | Location | Description | District | Neighborhood | Latitude | Longitude | GeoLocation | |
|---|---|---|---|---|---|---|---|---|
| 0 | 2021/03/25 01:20:20+00 | 0 S CAREY ST | HOMICIDE | SOUTHERN | UNION SQUARE | 39.2879 | -76.6382 | (39.2879,-76.6382) |
| 1 | 2021/03/25 01:20:20+00 | 0 S CAREY ST | SHOOTING | SOUTHERN | UNION SQUARE | 39.2879 | -76.6382 | (39.2879,-76.6382) |
| 2 | 2021/03/24 00:08:00+00 | 4900 YORK RD | COMMON ASSAULT | NORTHERN | WINSTON-GOVANS | 39.3480 | -76.6096 | (39.348,-76.6096) |
| 3 | 2021/03/24 07:53:00+00 | 400 E PATAPSCO AVE | COMMON ASSAULT | SOUTHERN | BROOKLYN | 39.2372 | -76.6049 | (39.2372,-76.6049) |
| 4 | 2021/03/24 21:54:00+00 | 2500 GREENMOUNT AVE | ROBBERY - CARJACKING | NORTHERN | HARWOOD | 39.3182 | -76.6095 | (39.3182,-76.6095) |
From the raw dataset, the year 2021 contains the first 3 months while the data from 1963 to 2013 is very sparse with just few data recorded per year. Therefore, for this project, the dataset was subsetted from 2014 to 2020 which covers 7 years period.
bpd = bpd[(bpd['year']>=2014) & (bpd['year']!=2021)]
bpd.groupby(['year','day_name']).size().unstack('day_name')
| day_name | Friday | Monday | Saturday | Sunday | Thursday | Tuesday | Wednesday |
|---|---|---|---|---|---|---|---|
| year | |||||||
| 2014 | 6826 | 6675 | 6334 | 6056 | 6359 | 6331 | 6487 |
| 2015 | 7029 | 7182 | 6582 | 6344 | 6906 | 7034 | 6757 |
| 2016 | 7289 | 7048 | 6610 | 6545 | 6899 | 7055 | 6984 |
| 2017 | 7747 | 7523 | 7234 | 7093 | 7310 | 7363 | 7550 |
| 2018 | 7167 | 7117 | 6551 | 6396 | 7064 | 7026 | 6857 |
| 2019 | 6700 | 6695 | 6530 | 6219 | 6432 | 6795 | 6616 |
| 2020 | 5414 | 5196 | 5299 | 5035 | 4952 | 4889 | 4961 |
Finally, the crime date was converted to pandas datetime and the index as datetimeindex. Some additional features were created such as year, month, day name and seasons.
Summary of preprocessing steps:
- Checked for missing values and dropped all columns with missing values greater than 70%
- Dropped columns (‘CrimeCode’,’Total_Incidents’,’Post’,’Inside_Outside’,’Premise’,’RowID’,’X’,’Y’) that are not necessary for this project
- Dealt with the remaining missing values by replacing missing values in each column by the mode of the categorical variables and dropped the remaining missing values from the data
- Converted crime date to datetime, split it into components such as year, month, time, day, hour, and minute.
- Set the dataframe index to datetimeindex
- Limit the data to the past 7 years covering 2014 to 2020 due to sparsity of the raw dataset
- Extract the four meteorological seasons (spring, summer, fall and winter) from the crime month to show how crimes changes with the seasons
Exploratory Data Analysis (EDA)
Descriptive statistics
The following figures shows the relative proportion and distribution of all the crime types reported by the Baltimore PD.
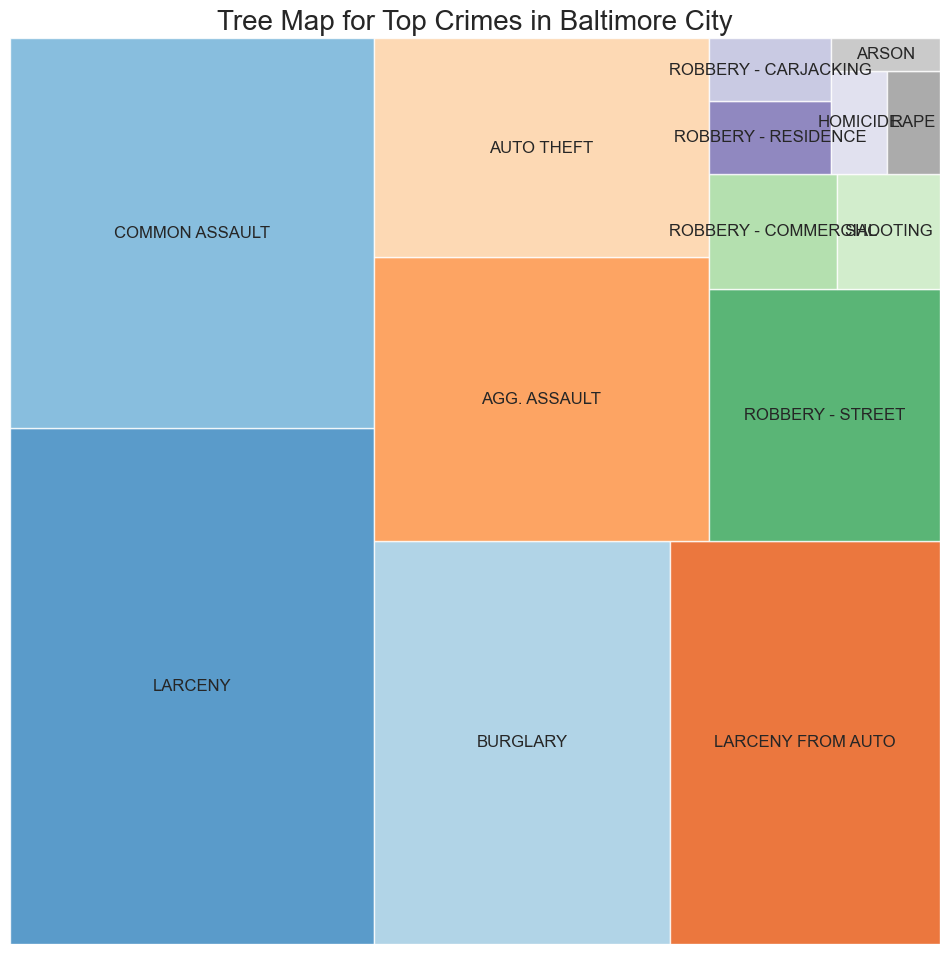
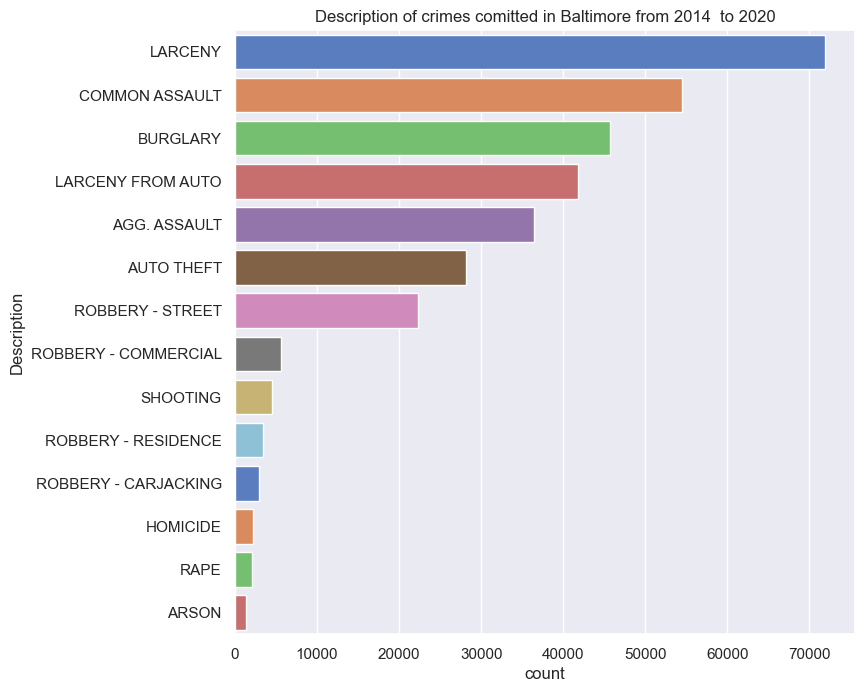
Among the 14 crime types reported, the top 5 crimes (Larceny-22.3%, Common assault-16.9%, Burglary-14.2%, Larceny from auto-12.9%, Agg. assault-11.3%) make up 77.6% of the total crimes
LARCENY                 22.273984
COMMON ASSAULT          16.865132
BURGLARY                14.164420
LARCENY FROM AUTO       12.935248
AGG. ASSAULT            11.263438
AUTO THEFT               8.714399
ROBBERY - STREET         6.902988
ROBBERY - COMMERCIAL     1.752909
SHOOTING                 1.398798
ROBBERY - RESIDENCE      1.058308
ROBBERY - CARJACKING     0.916539
HOMICIDE                 0.676958
RAPE                     0.652814
ARSON                    0.424066
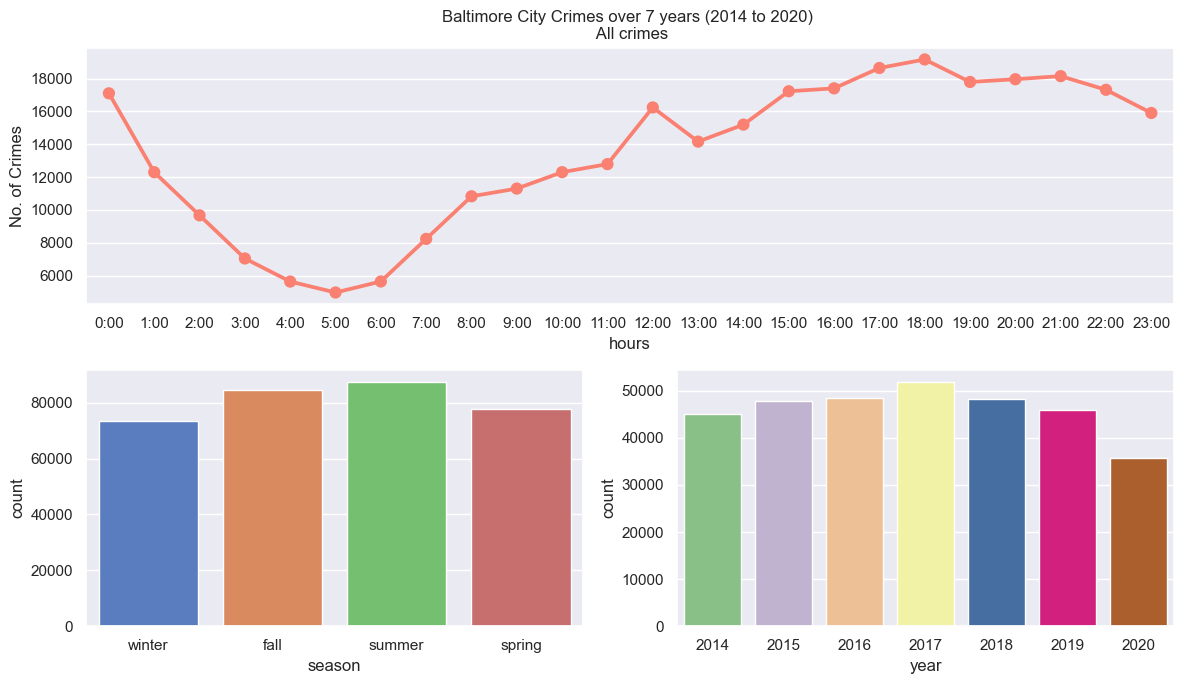
From the figure above, you can see that there is a clear pattern in crime and the hour of the day, seasons and year. Generally, crime is low in the early morning hours from around 4:00 AM to 6:00 AM and it rises steadily to its peak in the late evening from 5:00PM. The crimes remains high throughout the night until it starts to decrease after midnight. It can also be seen that majority of the crime occur during summer when the weather is really nice for outdoor activities. The overall crime trend reveals that crimes start increasing gradually from 2014 until it reached the peak in 2017 and start decreasing steadily until reaching the lowest in 2020
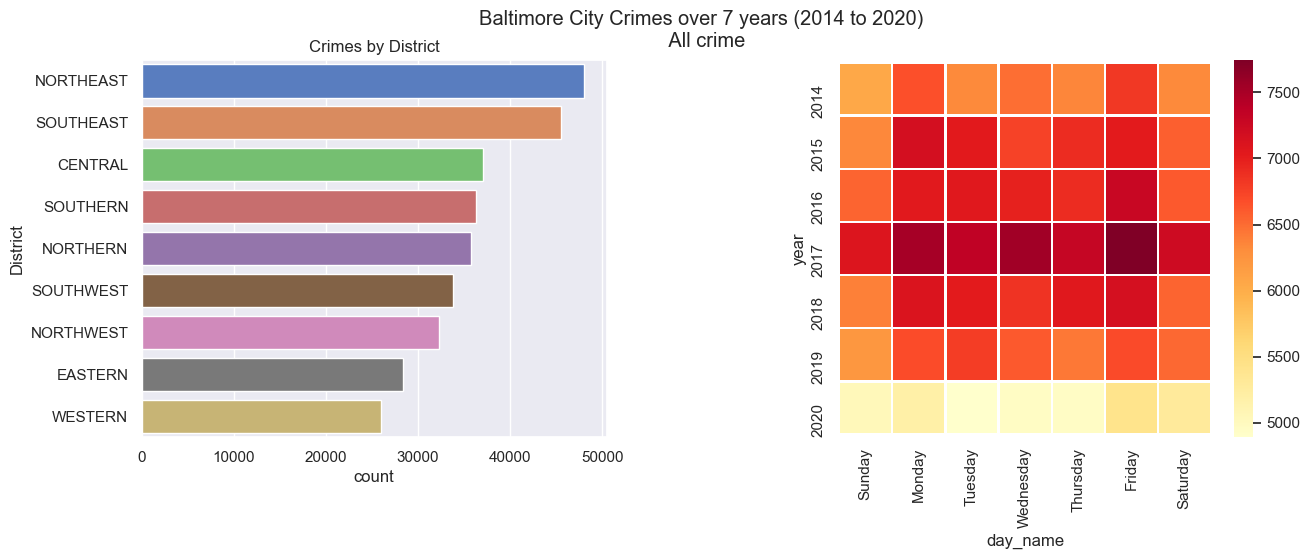
The northeast and southeast police district has the highest recorded overall crimes in Baltimore, while the western district has the lowest. The heatmap plot also reveals that fridays is the likely day that crimes occur in the city.
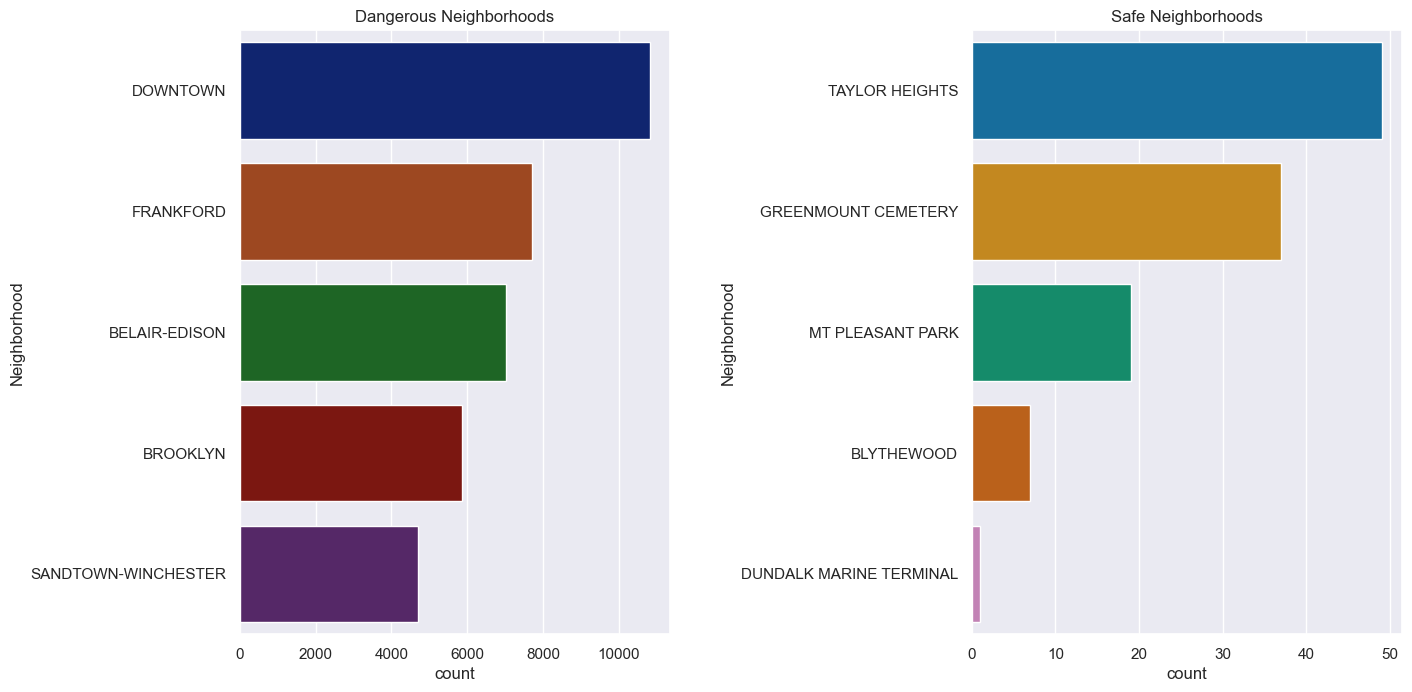
Safety within Baltimore Neighborhoods
This analysis was able to reveal that Downtown is the most dangerous neighborhood with crimes rate that was over 12,000 for the period under consideration. The safest neighborhoods all have crime rates less than 50 over the 7 years period. They include Taylor heights, Greenmount cemetery, Mt. pleasant park, Blythewood and Dundalk marine terminal.
Analyzing Individual Crime Type
Yearly trends of individual crime types
Examining the individual crime types reveals that only five crime types show increasing trends. Agg, assault increased conseiderably when comparing the count between 2014 and 2020. Homicide, Robbery-carjacking, shooting and Rape all display increased trends although they all make up a small fraction of the overall crime.
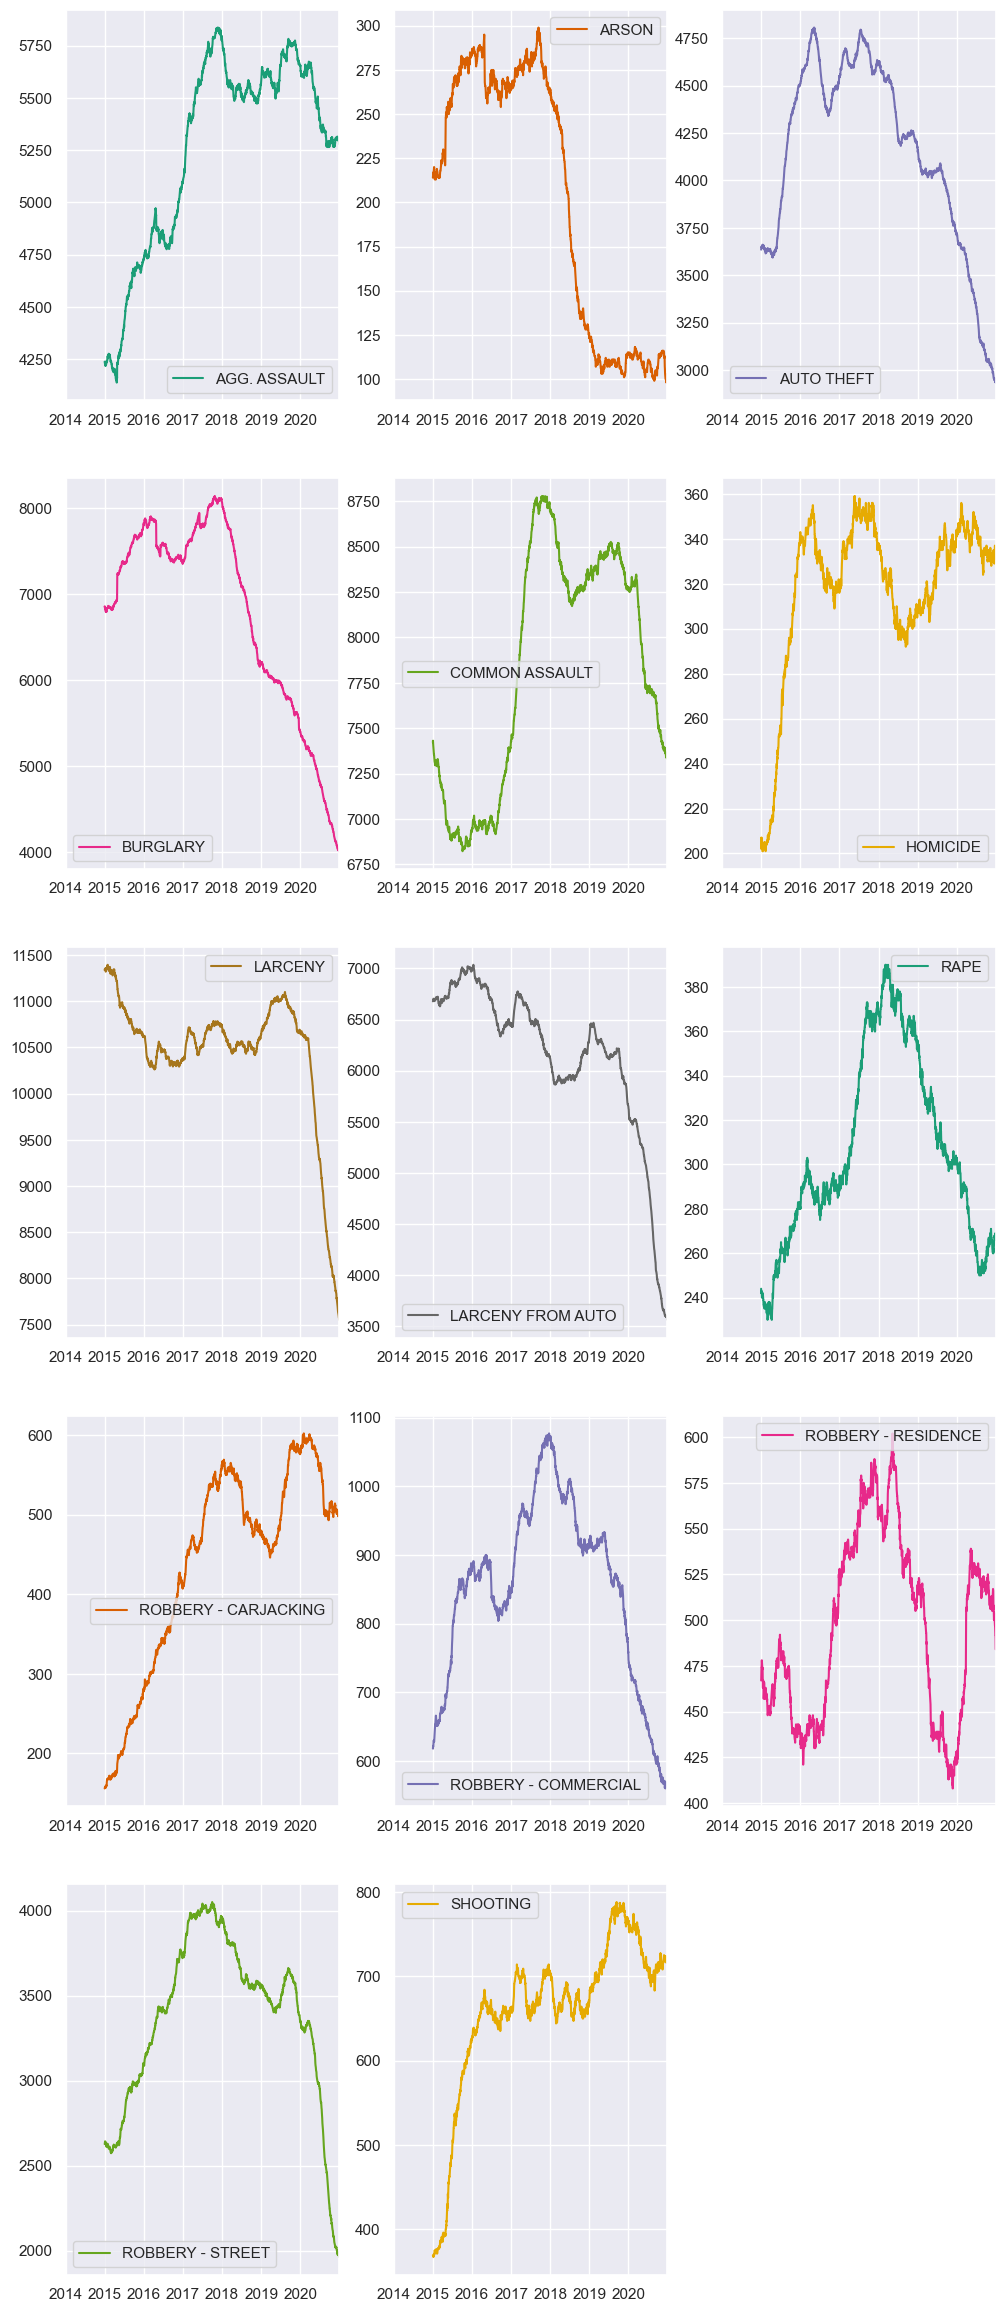
Summary of crime types with increasing trends
| Crime Types | Increase from 2014 to 2020 (%) |
|---|---|
| Agg. assault | 23 |
| Homicide | 70 |
| Rape | 8 |
| Robbery-Carjacking | 400 |
| Shooting | 100 |
For all the crime types with increasing trends, the following table shows the dangerous neighborhoods and police districts.
| Crime type | Neighborhood | Police District |
|---|---|---|
| Agg. assault | Downtown | Northeast |
| Homicide | Sandtown-Winchester | Western |
| Rape | Downtown | Northeast |
| Robbery-carjacking | Frankford | Northwest |
| Shooting | Sandtown-Winchester | Western |
Further analysis of the individual crimes with increasing trends reveals that summer is the most season when most of the crimes occurs (homicide, agg.assault, shooting) and spring/summer in the case of rape. For majority of the crime type (agg.assault, homicide, shooting and carjacking), the lowest occurrence is reported between 5am and 7am. It then starts to increase steadily until it reaches the peak between 9am and midnight. Rape on the other hand has the lowest occurrence between 6am and 11am with some few spikes around noon and 3pm. It then increases gradually until it reached the peak around midnight.
Conclusions
Analyzing 7 years (2014 to 2020) of Baltimore City crime data reveals that five crime types (Larceny, Common assault, Burglary, Larceny from auto, agg.assault) make up the majority of crime in the city, amounting to about 78% of the overall crime. Among the crime types reported, five (agg.assault, homicide, rape, robbery-carjacking and shooting) exhibit increasing trends with percentages increase that range from 8% to 400%. For most of these crime types, crime is low in the early morning hours from around 5am - 7am and rises steadily to its peak between 9pm and midnight. It also reveals that summer is the season when crime is likely to occur. Downtown is considered to be the most dangerous neighborhood because the crime count is highest. Rape on the other hand, usually occurs mostly around midnight and reduces gradually until it reaches the lowest in the early morning hours.
Check out full codes and notebook on github