Ola Sanusi, PhD

Educator | Data Scientist | Researcher
View My LinkedIn Profile
Cyclistic bike-share case study | Exploratory Data Analysis (EDA) using R
Author: Ola Sanusi, PhD
(Google Data Analytics Certificate Capstone Project submitted by Ola Sanusi, PhD)
Background
In order to maximize the number of annual memberships, Cyclistic bikes decided to determine how their casual riders and annual members differs, with the hope of using the insights gained to design new strategy that will help convert casual riders into annual members. The goal of this case study is to utilize data analytic skills such as spreadsheet and R programming to analyze historical bike trip data and report findings that will guide Cyclistic decision makers on the right marketing strategy to employ.
Problem Statement
Cyclistic bikes believe that maximizing the number of annual members in very important for the company’s future growth because annual members are more profitable than casual riders. Cyclistic bikes decided they need to understand how casual riders differ from annual members, and use this findings to effectively design appropriate marketing strategy to help convert casual riders into annual members.
The Dataset
Historical bike trips data covering 12 months from September 2020 to August 2021 was used in this case study. The 12 files were merged into a single file and some columns renamed. Additional features created include ride_length and day_of_week. Some unneeded columns were dropped from the data and all rows with missing values in the ride_length and day_of_week columns also dropped. All codes used in the preprocessing steps can be found on github. The following are summary of the preprocessing steps:
- unneeded columns dropped
- rows with missing values in the ride length and day of week columns dropped
- user type column recoded from 4 categories to 2 categories (casual and member)
- numeric values that appear in the date columns were converted to the proper datetime format
- all entries when bikes are checked for quality are removed
- outliers such as when ride length are negative or too large are removed
The final dataset after completing all the data wrangling and cleaning contains 4.45 million rows and 10 columns. The first few rows of the cleaned data is shown in the figure below.
| trip_id | bikeid | start_time | end_time | from_station_name | to_station_name | usertype | ride_length | day_of_week | ride_length_hms |
|---|---|---|---|---|---|---|---|---|---|
| 2B22BD5F95FB2629 | electric_bike | 2020-09-17 14:27:11 | 2020-09-17 14:44:24 | Michigan Ave & Lake St | Green St & Randolph St | casual | 1033 secs | Thursday | 17M 13S |
| A7FB70B4AFC6CAF2 | electric_bike | 2020-09-17 15:07:31 | 2020-09-17 15:07:45 | W Oakdale Ave & N Broadway | W Oakdale Ave & N Broadway | casual | 14 secs | Thursday | 14S |
| 86057FA01BAC778E | electric_bike | 2020-09-17 15:09:04 | 2020-09-17 15:09:35 | W Oakdale Ave & N Broadway | W Oakdale Ave & N Broadway | casual | 31 secs | Thursday | 31S |
| 57F6DC9A153DB98C | electric_bike | 2020-09-17 18:10:46 | 2020-09-17 18:35:49 | Ashland Ave & Belle Plaine Ave | Montrose Harbor | casual | 1503 secs | Thursday | 25M 3S |
| B9C4712F78C1AE68 | electric_bike | 2020-09-17 15:16:13 | 2020-09-17 15:52:55 | Fairbanks Ct & Grand Ave | Fairbanks Ct & Grand Ave | casual | 2202 secs | Thursday | 36M 42S |
| 378BBCE1E444EB80 | electric_bike | 2020-09-17 18:37:04 | 2020-09-17 19:23:28 | Clark St & Armitage Ave | NA | casual | 2784 secs | Thursday | 46M 24S |
Exploratory Data Analysis (EDA)
The figures below show the distribution of Cyclistic bikes users and the the type of bikes used over the 12 months period.
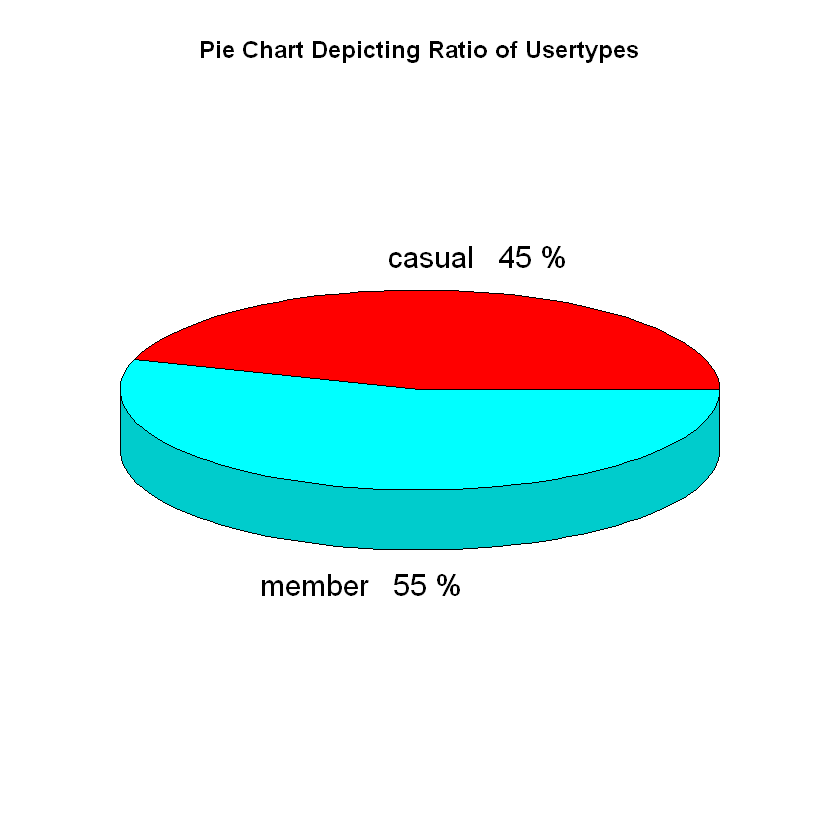
Figure 1: Distribution of Cyclistic bikes users over 12 months period
During the 12 months period, Cyclistic bikes has 55% (2,452,006) annual members and 45% (2,005,628) casual riders showing that there are more annual members.
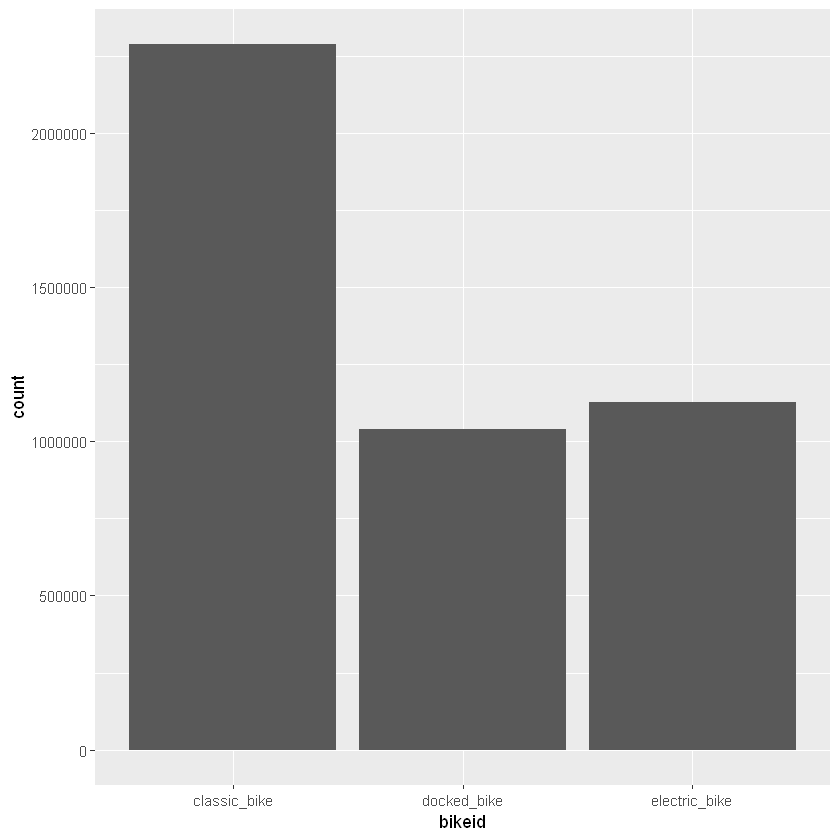
Figure 2: Different type of bikes used by all the users
Classic bikes (51.3%) is the most popular bike used by all members while the remaining bike types (docked and electric) respectively account for 23.4% and 25.3%. Bike usage was found to the highest during the weekend with Saturday being the day when most user ride bikes. Descriptive statistics of the dataset reveal that the mean ride length is 21min 57sec (1317sec), median ride length is 12min 57sec (777sec), and maximum ride length recorded is 1day 5hrs 58min 37 sec(107917sec).
Comparison of Casual Riders and Annual Members
When comparing the two type of riders, the casual riders spend longer time using the bikes than the annual members as presented by the higher average, median and maximum ride lengths (Table 1).
Table 1: Statistical comparison of the user type
| User type | Average ride length | Median ride length | Maximum ride length |
|---|---|---|---|
| Casual | 31min 14sec | 17min 35sec | 1d 5hrs 58min 37sec |
| Member | 14min 22sec | 10min 18sec | 1d 4hrs 4min 59sec |
Both usertype predominantly used the classic bike with the annual members using higher proportion of classic bikes than casual riders (Figure 3).
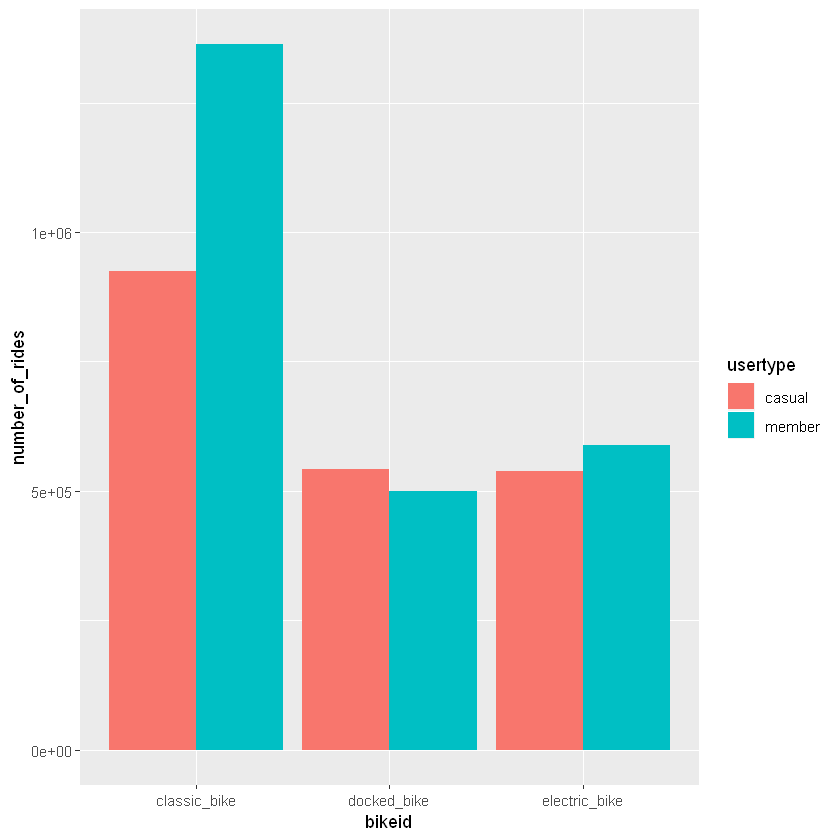
Figure 3: Number of rides by bike type
During the weekday, annual members take more rides using bikes while casual members take more rides during the weekend. The highest number of rides taken by casual riders occurs on Saturday whereas annual members experiences the highest number of rides on Tuesday and Wednesday (Figure 4). This suggest that most of annual members use bikes to communicate for work during the weekday.
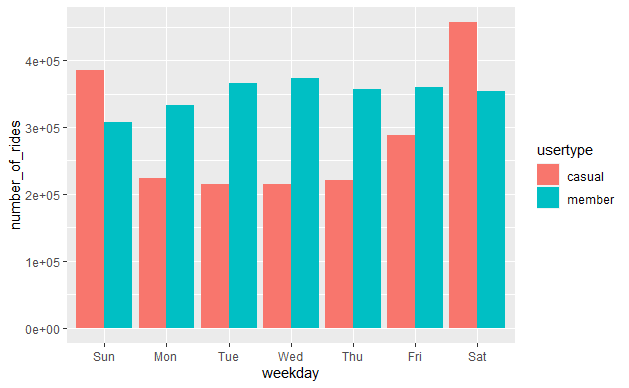
Figure 4: Weekly number of rides by Cyclistic users
On the other hand, casual riders tend to spend more time on bike trips throughout the week (Figure 5).
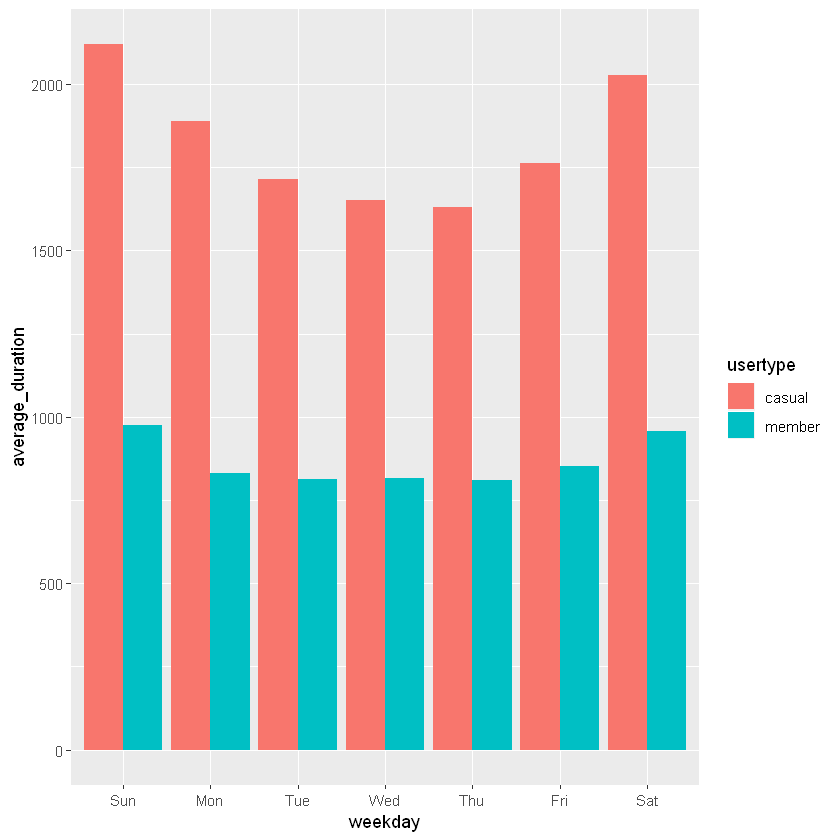
Figure 5: Average duration of weekly rides
Irrespective of the type of bikes used, annual members spend the same amount of time on the bike but casual riders spend more time when using the docked bikes than when using the other bikes (Figure 6).
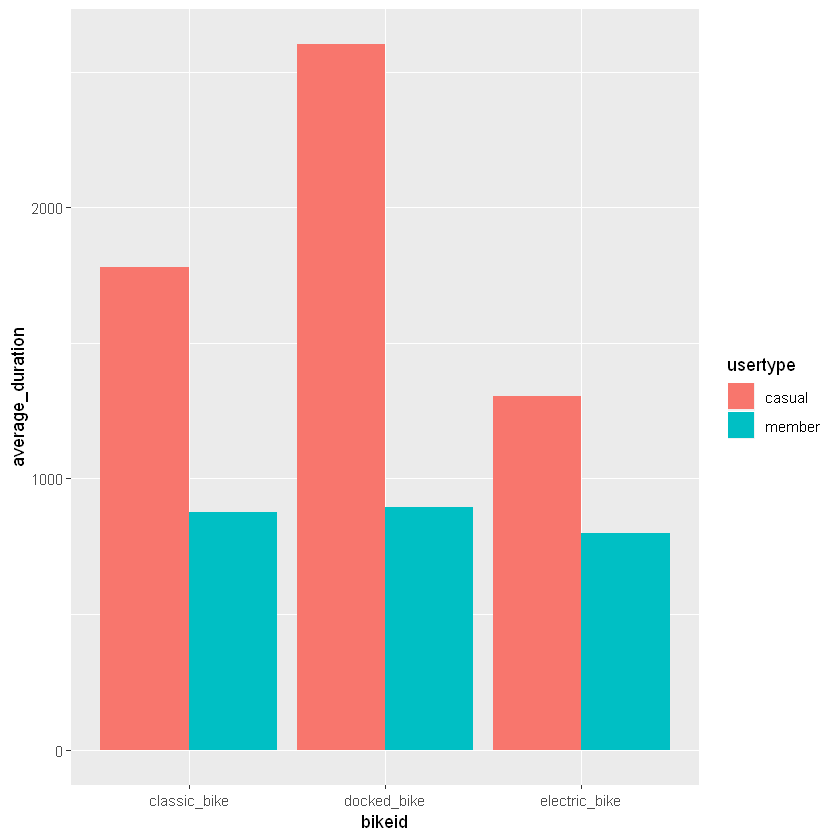
Figure 6: Average duration of rides by bike type
Summary and Recommendations
Analyzing 12 months of Cyclistic bike trips data reveals that there are more annual members than casual riders. Majority of the bike rides was found to occur during the weekend with the casual riders use the bikes more during the weekend and annual member using bikes more during the weekday. Both of the user type predominantly use the classic bikes with annual members using higher proportion than casual riders. Irrespective of the bike type used, annual member tend to spend roughly the same amount of time on the different bikes whereas casual riders spend more time when only using the docked bike.
Based on the insights from this brief exploratory analysis, I would recommend the following:
- Cyclistics should provide more classic bikes because of its high demand
- Provide casual riders with insentives to encourage them to upgrade to the annual membership because they spend longer time using the bikes throughout the week.
- Increase the number of bikes available for users during the weekend because more trips are expected during that period.
Check out full codes and R notebook on github.